Palette of Place // Personal Project
Palette of Place
Palette of Place is a Data visualization project that uses the programming language Processing to query the Instagram API and display a calendar year’s worth of images with the same hashtag.
I programmed and designed Palette of Place to investigate the question “What are the colors in a place and how do they change over time?”
Initially a gallery installation

I produced two large format prints
And five smaller prints
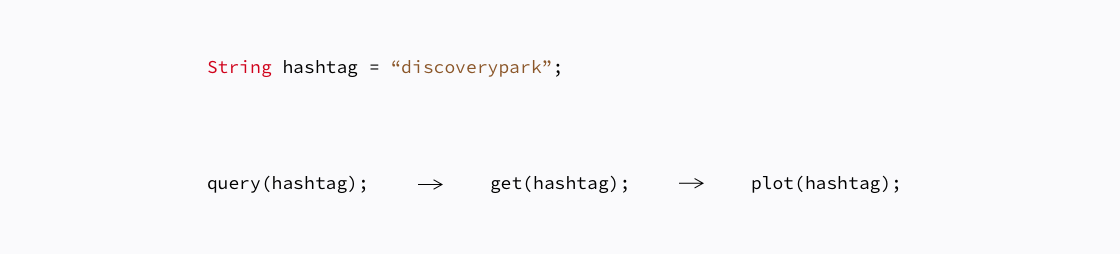
How it works
For a given hashtag, there are three discrete Processing applications. One that queries Instagram and returns the number of photos with a given hashtag for a given date range, one that fetches those images, and another that plots them.
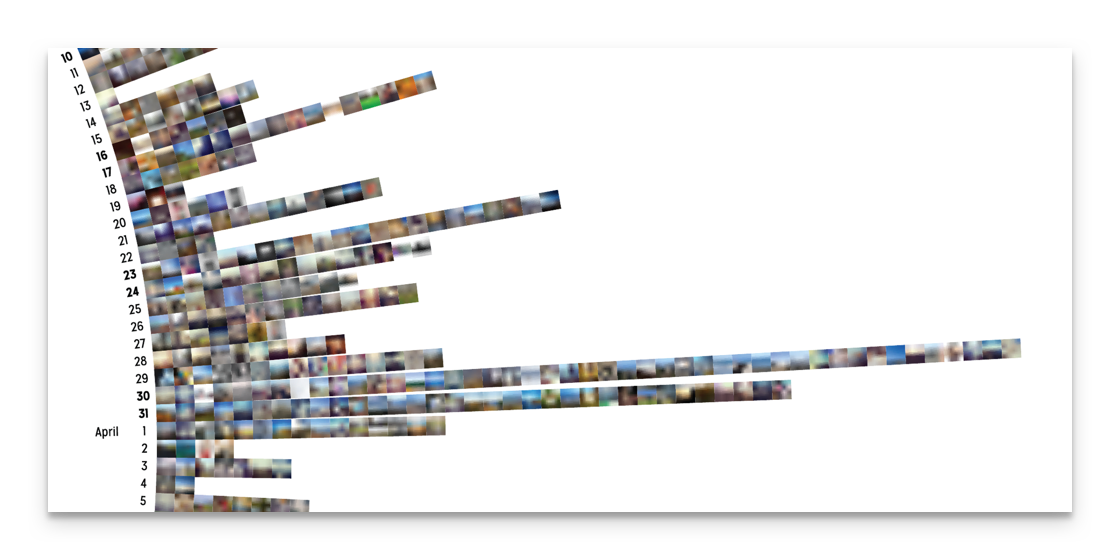
Images are abstracted to isolate color from context, and plotted by date in a radial format, with weekends in bold and January 1st at the 12 o’clock position.

The final version of the project was the result of months of iteration, drop me a line if you’d like to learn more!